Executing the Test Kit
Summary of Steps
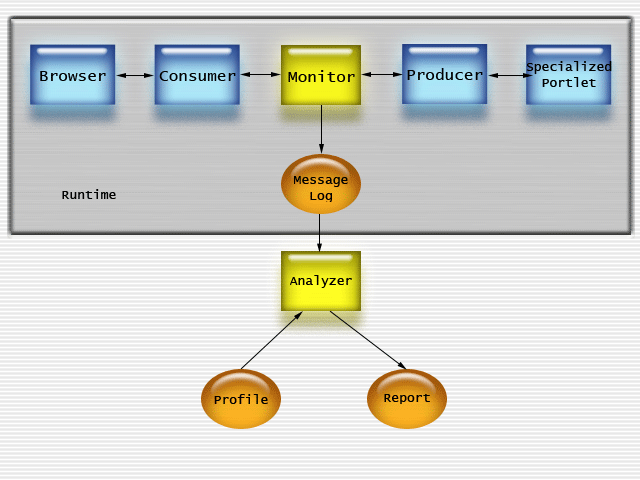
Executing the Test Kit happens in 2 phases. The first phase is the Monitoring phase, during which a message log is created from a running WSRP service. The second phase is the Analysis phase, during which the log file is analyzed for conformance.
Here is an architectural diagram of the components:

In general, these are the steps for running the test kit:
- Configure the Producer to listen on a particular port (e.g. 8080).
- Configure the Consumer to write to a particular port (e.g. 8081).
- Configure the Monitor to listen to the Consumer (e.g. on 8081) and send to the Producer (e.g. on 8080) by setting the port numbers in the config file.
- Start your Producer (e.g. WSRP4J on Tomcat)
- Start the Monitor (bin/Monitor.bat)
- Start your Consumer (e.g. WSRP4J Swing Consumer)
- Exercise the User Interface
- Exit the Consumer
- Stop the Monitor (type "exit")
- Run the Analyzer (bin/Analyzer.bat)
- View the Report (logs/AnalyzerLog.xml)
The Monitor Component
The Monitor is a WS-I Testing Tools component that intercepts web service traffic between parties and writes the messages to a log file.
The Functional Specification for the Monitor component can be found here.
The Monitor gets parameters from a configuration file, the path to which is passed in at runtime. The config file is found in wsrptk/config. Here is a sample of configuration file:
|
. . .
<wsi-monConfig:logFile replace="true" location="../logs/MonitorLog.xml"> <wsi-common:addStyleSheet href="../xsl/log.xsl" type="text/xsl"/> </wsi-monConfig:logFile> . . . <wsi-monConfig:manInTheMiddle> <wsi-monConfig:redirect> <wsi-monConfig:listenPort>8081</wsi-monConfig:listenPort> <wsi-monConfig:schemeAndHostPort>http://localhost:8080</wsi-monConfig:schemeAndHostPort> <wsi-monConfig:maxConnections>1000</wsi-monConfig:maxConnections> <wsi-monConfig:readTimeoutSeconds>15</wsi-monConfig:readTimeoutSeconds> </wsi-monConfig:redirect> </wsi-monConfig:manInTheMiddle> . . . |
The Analyzer Component
The Analyzer is a WS-I Testing Tools component that intercepts web service traffic between parties and writes the messages to a log file.
The Functional Specification for the Analyzer component can be found here.
The Analyzer gets parameters from a configuration file, the path to which is passed in at runtime. The config file is found in wsrptk/config. Here is a sample of configuration file:
|
<wsi-analyzerConfig:configuration name="Sample WSRP Profile Analyzer Configuration"
xmlns:wsi-analyzerConfig="http://www.ws-i.org/testing/2003/03/analyzerConfig/"> . . . . <wsi-analyzerConfig:reportFile replace="true" location="../logs/AnalyzerLog.xml"> <wsi-analyzerConfig:addStyleSheet href="../xsl/report.xsl" type="text/xsl"/> </wsi-analyzerConfig:reportFile> <wsi-analyzerConfig:testAssertionsFile> ../profiles/WSRPProfileTestAssertions.xml </wsi-analyzerConfig:testAssertionsFile> <wsi-analyzerConfig:logFile correlationType="endpoint"> ../logs/MonitorLog.xml </wsi-analyzerConfig:logFile> . . . . </wsi-analyzerConfig:configuration> |

